 Calyxra.
Which number should control next week’s media budget?
Whether contribution economics support more spend while channel dashboards report efficient growth.
Attributed conversion value
Channel credit under model rules
Realised commercial economics
Source · formula · timing · refund lag · purpose · owner
ApprovedThe resolution assigns each metric a job. It does not make attributed revenue equal company revenue.
Three internally consistent reports answered three different questions, but no metric had a documented decision right.
Reconcile the eligible orders, label each metric’s role, and assign one Finance-grade budget guardrail.
Sources, formulas, timing, refund lag, purpose, and owner are approved in one metric contract.
Evidence package / 01–03
See what changed in the numbers.
These dashboard reconstructions use constructed data. The pixelated identity field demonstrates redaction; it does not conceal a real client. The daily chart values and example check results are available in the accompanying CSV.
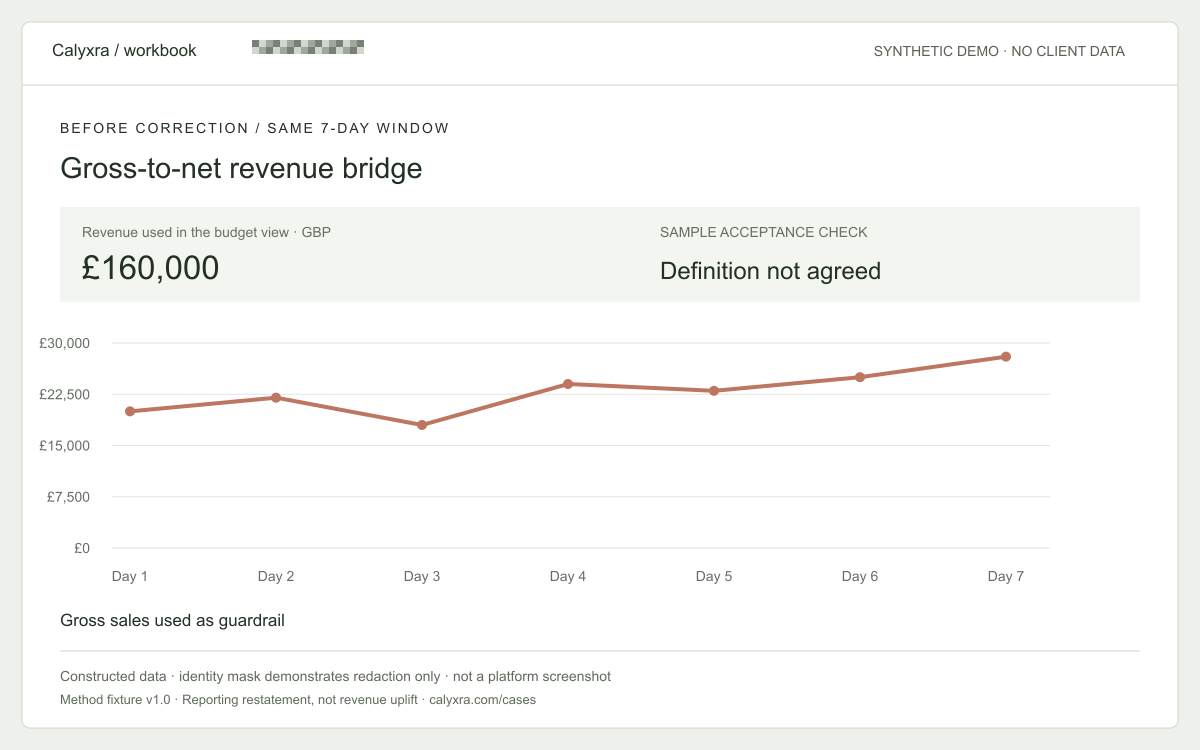
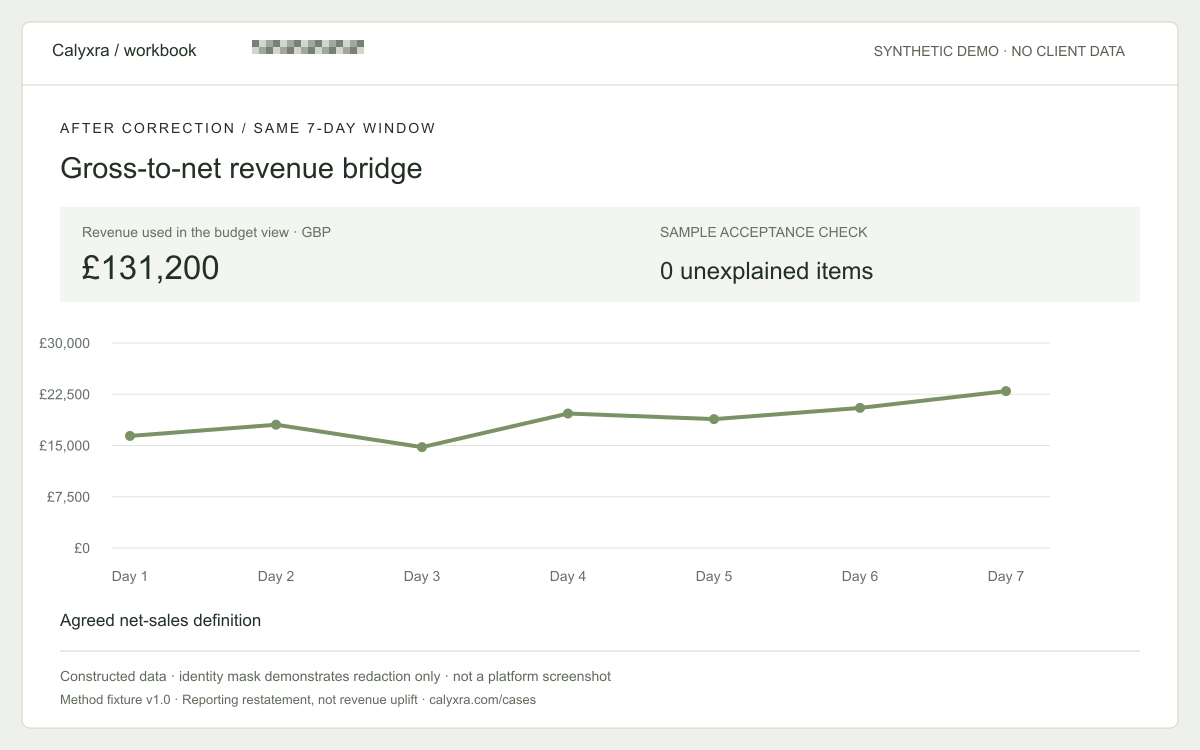
03 / Before & after reconciliation
Revenue used in the budget view
This is a restatement of the same period, not a time-series experiment or a claim of revenue growth caused by Calyxra.
BeforeDefinition not agreed
After0 unexplained items
The check results are separate constructed fixtures, not measurements inferred from the revenue chart or logs from a client engagement.
Inspect the seven-day dataset
| Day | Before correction | After correction |
|---|---|---|
| 1 | £20,000 | £16,400 |
| 2 | £22,000 | £18,040 |
| 3 | £18,000 | £14,760 |
| 4 | £24,000 | £19,680 |
| 5 | £23,000 | £18,860 |
| 6 | £25,000 | £20,500 |
| 7 | £28,000 | £22,960 |
| Total | £160,000 | £131,200 |
The working method
What gets checked, changed and handed back.
There is no broken pixel in this scenario. Platforms report attributed conversion value, the attribution tool redistributes channel credit, and Finance uses realised commercial economics. The operating defect is that no metric has a documented purpose, owner, or decision right.
Decision Risk Score methodologyEvidence required
- Eligible-order populations by report
- Gross-to-net revenue bridge
- Refund, cancellation, tax, fee, and currency treatment
- Attribution windows, timezones, and metric formulas
Correction sequence
- Build an order-level bridge from Shopify gross sales to the agreed commercial definition.
- Align order eligibility, timezone, currency, and refund lag.
- Label each metric as observed, attributed, modelled, or financial.
- Define which metric controls budget guardrails and which remains directional.
- Assign an owner, refresh cadence, and exception process.
Closure criteria
- Growth and Finance use the same documented eligible-order population.
- Remaining reconciliation variance is inside the agreed tolerance or tied to named timing and currency items.
- No report presents overlapping channel-attributed revenue as additive company revenue.
- Each controlling metric has a source, formula, timezone, refund lag, purpose, and owner.
- The decision owners approve the metric contract in writing.
Growth can pace channels without reopening the Finance definition at every budget meeting.
Reconciliation does not prove channel incrementality. If the remaining question is causal, the handoff specifies the experiment required instead of inventing a causal ROAS number.
A similar issue?
Request a 2-day incident review.
A focused diagnostic: evidence map, initial findings, and a proposed fix scope. Two business days from agreed scope, payment where applicable, and complete required data. We confirm feasibility and fee before work starts. Implementation and longer verification windows are scoped separately.